- Wireless Para, Barrackpore, Kolkata 700 122, India
- info@durgabrothers.com


-
Opening Hour Mon - Fri 10:00 AM - 6:00 PM
Sat & Sun - CLOSED

Custom Data & Analytics Dashboards


Custom Data & Analytics Dashboards
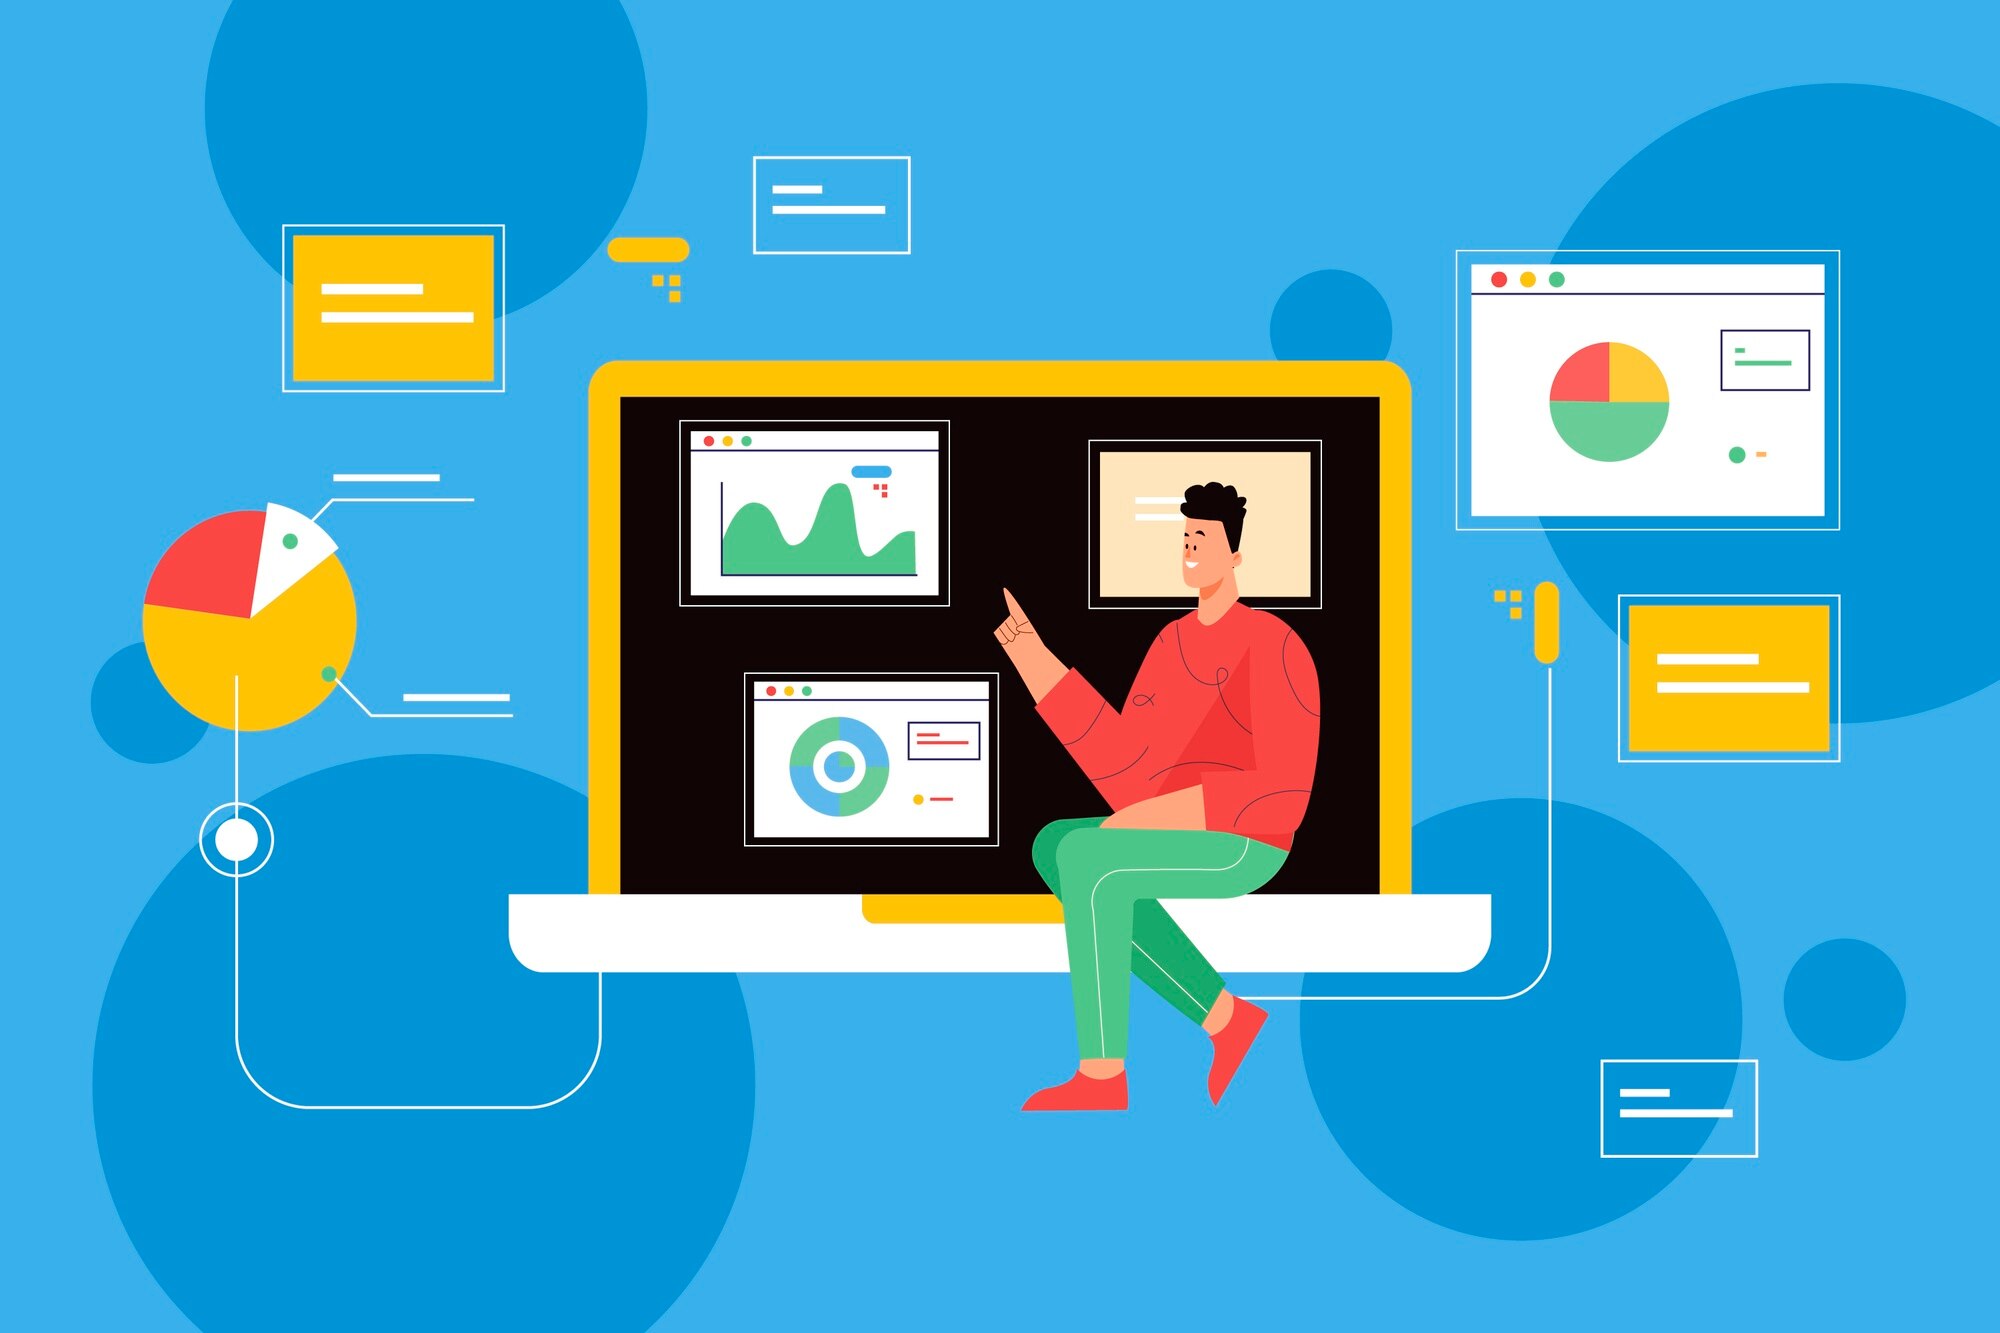
In the modern enterprise, raw data is useless if you cannot understand it. At Durga Brothers IT Solutions, we transform your fragmented spreadsheets and disconnected databases into clean, real-time analytics dashboards. We build the visual intelligence layer that allows executives and stakeholders to monitor key performance indicators (KPIs), track revenue, and make critical business decisions at a glance.
We do not just plug in generic reporting tools. We build custom data pipelines and interactive visualizations—using tools like PowerBI, Tableau, or custom React/D3.js frontends—tailored exactly to your unique operational metrics. Whether you need to visualize global supply chain logistics, monitor server health, or track live e-commerce conversion rates across multiple regions, we deliver the exact numbers you need, right when you need them.

Real-Time Data Sync

Interactive
Visualizations
What Are The Benefits?
A custom dashboard eliminates the guesswork from your daily operations. By automating your reporting processes, you free your management team from spending hours building manual spreadsheets. Instead, you gain immediate, 24/7 visibility into your company's health, allowing you to pivot strategies instantly and uncover hidden revenue opportunities.
-
 Centralize metrics from multiple different software sources
 -
Completely eliminate manual, error-prone spreadsheet reporting
-
Identify hidden bottlenecks and new revenue opportunities
-
Track live operational performance and team output
-
Implement secure, role-based access for different managers
-
Make faster, highly accurate data-backed executive decisions


Frequently Asked Question
-
01. Can you connect the dashboard to our existing CRM or ERP?Yes. We specialize in custom API development. We can securely pull raw data from almost any modern software you currently use—including Salesforce, HubSpot, SAP, or custom legacy databases—and unify it into a single, cohesive dashboard.
-
02. Is the data updated in real-time?Absolutely. We engineer automated data pipelines that sync your metrics in real-time or at custom scheduled intervals. When a sale happens in your e-commerce store or a new lead enters your CRM, your dashboard updates immediately.
-
03. Can we set different access levels for different employees?Yes. We build robust, role-based access control (RBAC) into all of our custom dashboards. This means your CEO can see global revenue metrics, while a regional manager only sees the specific performance data relevant to their specific department or location.